Pscan Help
Input
Submitting gene sets
Submitting gene sets and your own matrices
Output
Reading p-values
Comparing the results of the same matrix on different gene sets
Resetting the interface
Input:
Just submit a list of gene or transcript identifiers: RefSeq (for human, mouse, and drosophila, e.g. NM_000546)
TAIR (e.g. AT1G08810) for Arabidopsis; SGD (e.g. YPL248C) for yeast;
and specify the source
organism as well as the region you want to be analyzed (w.r.t. the
annotated transcription start site). In case you have a list with other
descriptors (official gene name, Affy id, etc.) you can use
this tool for a quick
conversion.
With the "Select Descriptors"
option you can choose whether the analysis has to be performed with
the TFBSs matrices available in the JASPAR or TRANSFAC databases, or
if you want to upload a specific matrix. In the latter case, prepare
a TEXT file containing one or more matrices in the following format:
>matrix1
A_1 A_2 ..... A_n
C_1 C_2 ..... C_n
G_1 G_2 ..... G_n
T_1 T_2 ..... T_n
>matrix2
A_1 A_2 ..... A_n
C_1 C_2 ..... C_n
G_1 G_2 ..... G_n
T_1 T_2 ..... T_n
..and so on, where A_i, etc. are the frequencies of the four nucleotides in the
columns of the matrix. These values can be either integers or floating
point values, they will be automatically rescaled to frequencies summing
to one in each column. There's an example matrix file in the main page.
Notice that matrix names can contain only letters or digits.
Example: submitting gene sets
On the right-hand column of the main page several datasets are available
for testing the interface. Clicking on any link opens a page with a list
of gene RefSeq IDs, that can be copied and pasted in the text box of the
input form.
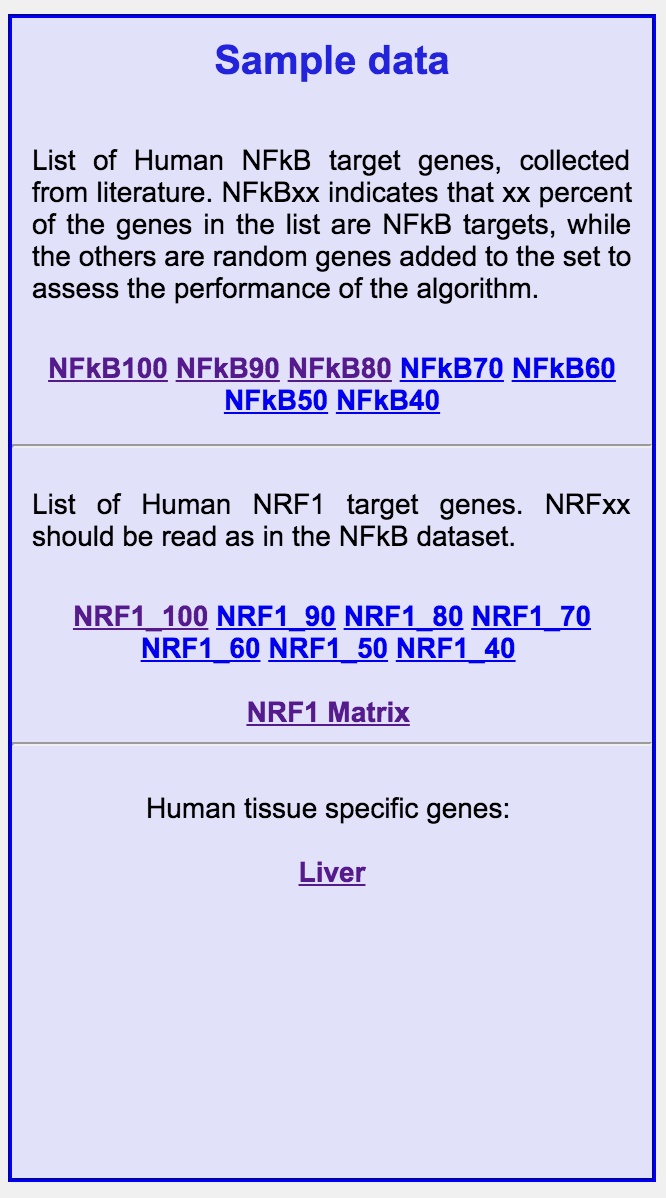
For example, click on the NFkB100 link. It contains a set of genes for
which the binding of NFkB in the promoter region has been determined
experimentally via ChIP on Chip. 100 indicates that all the genes of
the set are NFkB targets; the NFkBxx sets are sets in which xx percent of
the genes are NFkB targets, while the others have been replaced by random
genes to assess the performance of the algorithm. Open the NFkB100 link,
and copy and paste the identifiers in the input text-box:
Below the input box, you can choose the source organism (human, in this
case), the region, with respect to the TSS, you want to analyse, and the
matrix database you want to use (Jaspar, Transfac, or you can upload one
or more matrices). For NFkB100, leave all the options as they are.
If you want to submit a human gene set together with their orthologs in mouse,
just paste in the input box all the identifiers (both for human and mouse genes), and select "Human and Mouse" as source organism. Notice: Pscan does not
check whether the orthology annotations are correct!
Click "Run!"
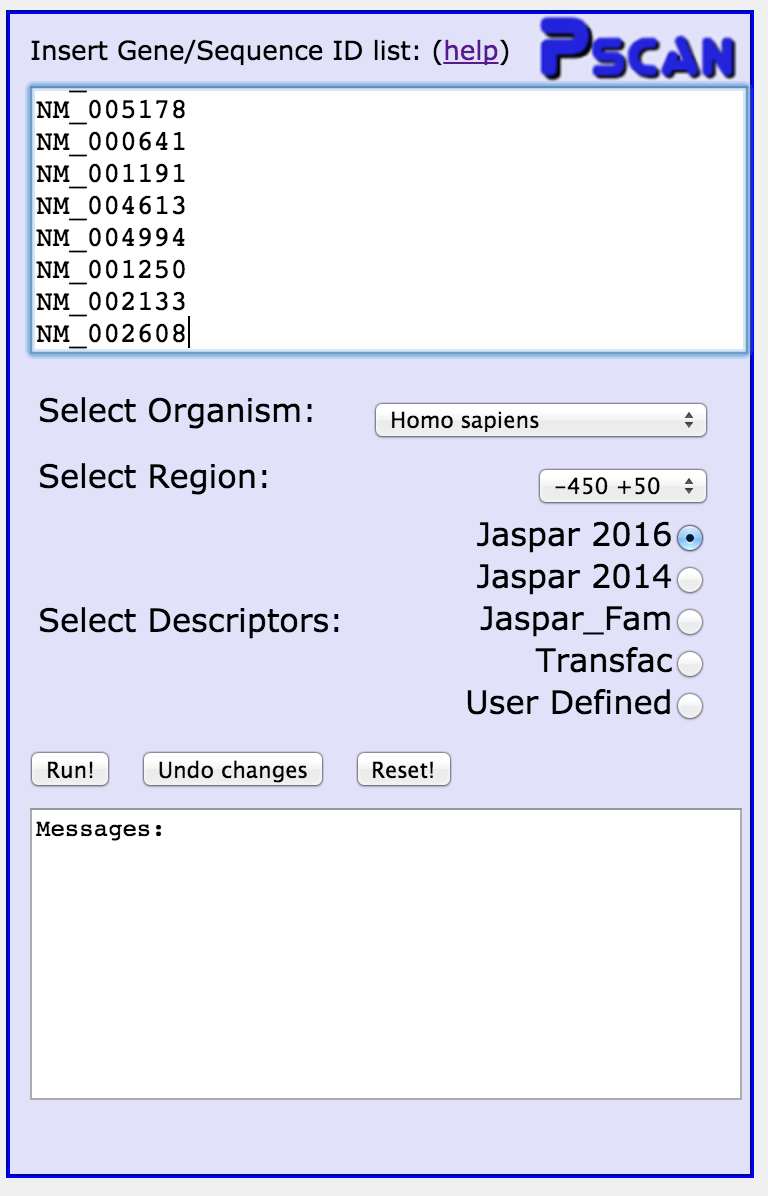
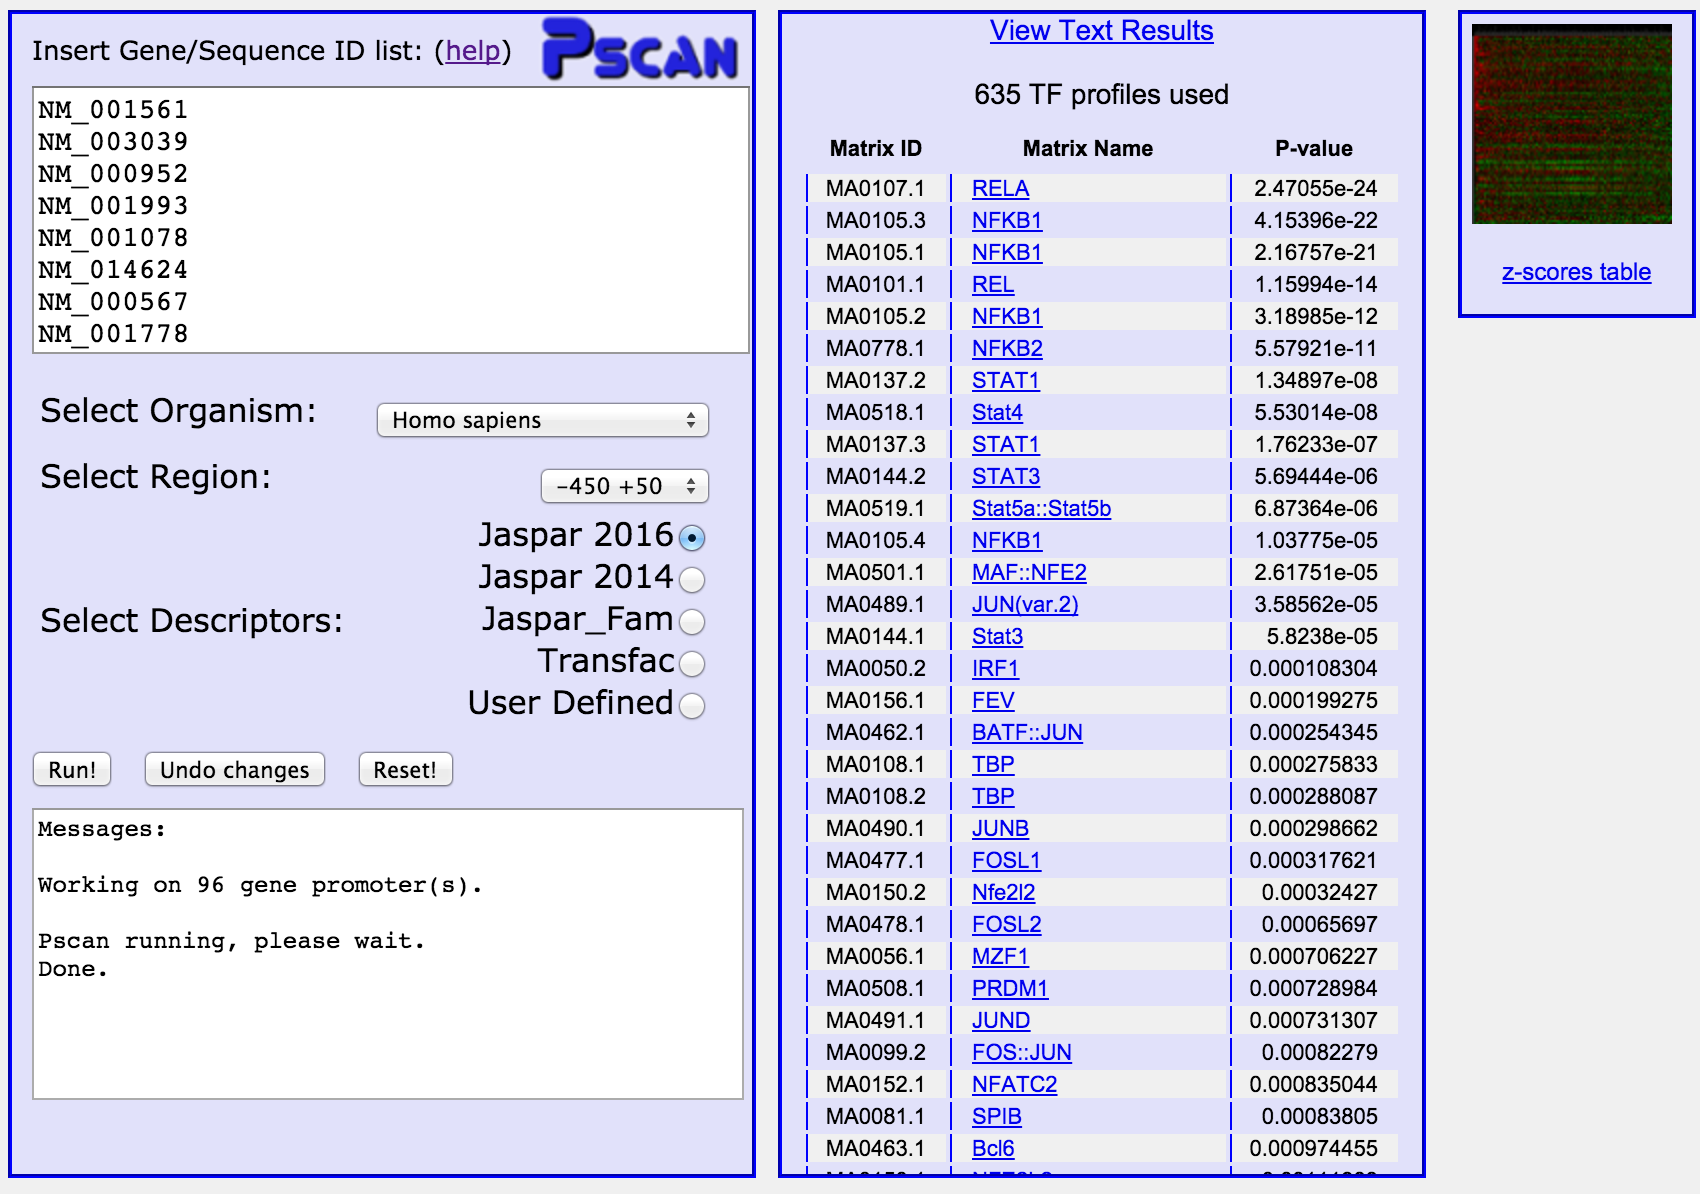
In the textbox under the "Run" button, a confirmation message has appeared.
In a few seconds, results will appear in the middle column of the page.
Similar experiments can be performed with all the the NFkBxx target
files.
Example: submitting gene sets and matrices
For the NRF1 sequence sets you also have to upload the NRF1 binding site
matrix, since it is not included in the TRANSFAC matrices publicly available.
The matrix is contained in this file. Save it on your
computer. In the input page, copy a set of NRF1 target genes from any NRFxx
file in the input text box, and select "User Defined". Just below
a file upload box will appear. Click on "browse", and locate the file containing
the NRF1 matrix you just saved. Finally, click on "Run".
 In this case the computation will take longer, since the program will have
to scan the whole promoter set (in this case, the whole human promoter set)
to build the background statistics to assess the significance of the results.
Once again, the results will appear in the middle column (otherwise, in case
of any problem with the matrix file an error message will appear in the
text box under the "Run" button). Everything now is the same as in the previous
example (see the Output section), with the exception that in the detailed results page the program
will not be able to output any external link for your matrix.
In this case the computation will take longer, since the program will have
to scan the whole promoter set (in this case, the whole human promoter set)
to build the background statistics to assess the significance of the results.
Once again, the results will appear in the middle column (otherwise, in case
of any problem with the matrix file an error message will appear in the
text box under the "Run" button). Everything now is the same as in the previous
example (see the Output section), with the exception that in the detailed results page the program
will not be able to output any external link for your matrix.
Output:
When you click the "Run" button, after a few seconds ("User Defined" matrices can take longer, since
the program has to scan the whole set of promoters of an organism to build
a background model) the result of the computation will appear in
the middle column of the page, together with a small image (the "heatmap")
on the right.
The output shows the ranking of the matrices selected according to their
enrichment p-values. At the top
of the column there's a link for downloading the results in text format
as well as the number of matrices used to analyze the sequences (see below,
section "Reading the p-value").
By clicking on a matrix name, you can open a dedicated page
showing the detailed results regarding the
matrix, and in particular 1) the matrix itself, its logo (at the bottom), its information
content and links to
its database entry as well as to the ID (PMID) of the PubMed entry describing its generation. A simple graphic representation shows the average matching value
of the matrix on the sequences analyzed compared to the average matching
value and standard deviation on the whole promoter set (same set of regions
w.r.t. the TSS as selected) of the same organism. Then, two further
boxes, showing on the left ("Sample statistics") the statistics concerning the matrix on the current dataset: the z-test p-value, the BOnferroni corrected p-value (see section Reading p-values for further info), mean and standard deviation
of the matching score on the current dataset, and finally dataset size.
these latter pieces of information can be useful to compare the results of
different datasets by using the "Compare with.." box next to
the statistics one, as explained in the Comparing the results of the same matrix on different gene sets section.
By clicking on the "Report Occurrences" button at the bottom of the "Matrix
Info" table you can retrieve, for each gene submitted, the best matching
oligo in each one, as well as its score (from 0 to 1) and its position
w.r.t. the annotated TSS. Occurrences are sorted according to their
score. The "Text Results" button allows you to download the occurrence
table in text format. On the bottom right hand of the page two diagrams
appear, showing the distribution of 1) the position of
the best occurrences w.r.t. the TSS and 2) the scores of the best occurrences.
Notice, for example, how the image below shows that most of the predicted sites are clustered in the -100 +50 region. Prediction are colored according to their
score (red-high)
It might happen that two different RefSeq IDs correspond to the same TSS (
e.g. the two genes differ in splicing). This corresponds to having the same
oligo appearing twice in the list, with identical score and position. Notice
however that duplicate input promoters are filtered out automatically by
the program in order not to bias the statistical evaluation.
The "heatmap" image shows in a microarray-like fashion the contribution of
each input gene to the score of each matrix. Red spots correspond to positive
contributions to the z-score, vice versa green spots (black spots are around
the average genome-wise score of the matrix itself).
Reading the p-value: when a result is significant?
Pscan associates with each matrix a p-value that is used for ranking the set
of matrix used in the analysis. The p-value should be read as:
If we take as many random genes from the same organism as in the input set,
and the corresponding regions selected in the input, what is the probability
of having the same score (enrichment) obtained in the input set?
Or - more simply - what is the probability of having the same result by chance?
Our experimental tests have shown how the z-test pvalue computed by pscan corresponds
to the experimental one (see article) - and is not an under-estimate as in many
other similar methods. Thus, typical pvalue thresholds
used in statistical testing can be used quite safely to report
significant results. However, keep in mind that if n
matrices are used, pscan performs n independent statistical tests. Thus, if
100 tests are performed and a p-value threshold of 0.01 is used, you can expect
to have one of 100 tests to have p-value lower than the threshold by chance! To
be on the safe side, you can use a Bonferroni-corrected significance threshold value (or, a Bonferroni corrected p-value), as follows.
Let T be your significance threshold (typically, 0.05 or 0.01). Let n be
the number of matrices used by p-scan (reported at the top of the output
column). To mantain the same level of significance you can use as threshold
T/n, or, alternatively, apply the significance threshold T not to the "raw"
p-value, but to the "Bonferroni corrected" p-value reported in the
detailed matrix output. See this page for further explanations.
Comparing different input gene sets:
In the detailed output for a given matrix, you can compare the results obtained
with the matrix on the gene set just submitted with the results the matrix
had produced on another gene set. The latter could be a "negative" gene set (or vice versa the current one could be the negative set, and the other one the one you
treated as "positive", the order does not matter). To perform the comparison,
you have to fill in the "Compare with..." box fields with mean, standard deviation and sample size values of the other analysis - for the current one you can find them in the "Sample Data Statistics" box or in the overall text output that can be downloaded from the main output page. Warning: make sure that the values you input are correct, and especially that they were obtained by using the same matrix!. Once you have clicked the "Go!" button, an output window will pop up and report if either of the two means is significantly higher than the other, together with a confidence p-value computed
with a Welch t-test (see Supplementary Material for further info).
Resetting the interface
At any moment, you can return to the initial web page (with empty input
boxes and no results in the middle column) by clicking the "Reset" button
in the left-hand column (next to "Run!").