Cscan Help
What does Cscan do?
Input (Gene set analysis - left panel)
Submitting gene sets
Output
Exploring the output
The hitmaps
Reading p-values
Data browsing (right panel)
Resetting the interface
Analysis examples
Cscan is a web server that includes a large collection of genome-wide ChIP-Seq experiments performed on transcription factors, histone modifications, RNA polymerases, and others. Enriched peak regions from the ChIP-Seq experiments are crossed with the genomic coordinates of a set of input genes, in order to identify which of the experiments have a significant high or low number of peaks within the input genes' loci. The input genes can be a cluster of co-expressed genes, or any other set of genes sharing a common regulatory profile.
In this way, you can single out which transcription factors are likely to be common regulators of the genes, and their respective correlations. Also, by examining results on promoter activation, transcription, histone modifications, polymerase binding, and so on, you can obtain information on the effect of the transcription factors (activation or repression) as well as of the cell or tissue specificity of the genes' regulation and expression.
You can submit a list of gene/transcript IDs for the analysis using the left-hand column of the interface,
(see Input (Gene set analysis - left panel))
or browse the collection of ChIP-Seq data available using the right-hand one
(see Data browsing (right panel)).
Input (Gene set analysis - left panel)
Submit a list of RefSeq or Ensembl transcript identifiers either by pasting the list in the text box (1a) or by uploading a text file with the list of the identifieris (1b). Then (step 2) you can specify the source organism,
as well as the region you want to be analyzed with respect to the
annotated transcription start site. Tr.Reg. stands for "Transcribed Region".
In case you have a list with other
descriptors (official gene name, Affy id, etc.) you can use
this tool for a quick
conversion.
Also, you can select a specific cell line to restricting your results to ChIP-Seq experiments carried out on that chosen cell line only.
Example: submitting gene sets
On the central column of the main page a few links taking to datasets (gene lists) are available
for testing the interface. The description of the link is quite self-explanatory. Clicking on any link
automatically uploads the corresponding RefSeq IDs in the text box of the
left-hand side input form.
For example, click on the JunD targets in HepG2 link. It contains a set of RefSeq gene promoters that have been shown to be bound by JunD by a ChIP-Seq experiment on the cell line HepG2. Their IDs will appear in the input box.
Below the input box, you can choose:
1. the source organism (Human RefSeq in this case, since you're using RefSeq IDs of human transcripts).
2. the region with respect to the TSS of the transcripts you want to analyse.
3. To include in the analysis all the experiments available in the database or only those performed on a specific cell line.
For JunD, leave all the options as they are, selecting human (RefSeq), the (-450,+50) region with respect to the genes' TSS, and all the experiments available (in human).
Click "Run!"
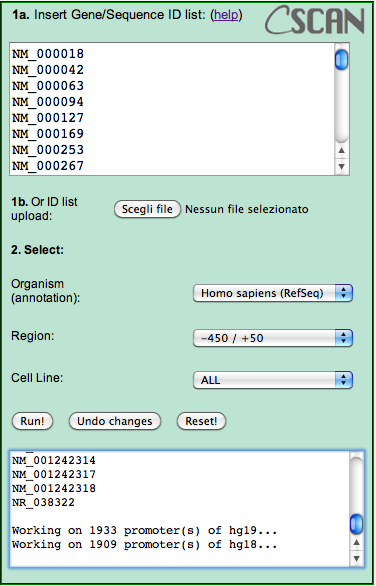
In the textbox under the "Run" button, a confirmation message will appear, together with the list of transcript IDs not available in the transcript database, usually just a few ones. Please note that, since we collected data both on hg18 and hg19 RefSeq and ENSEMBL annotations differ on the two, IDs listed as not appearing on hg18 might appear on hg19, and vice versa.
In a few seconds, results will appear in the middle column of the page.
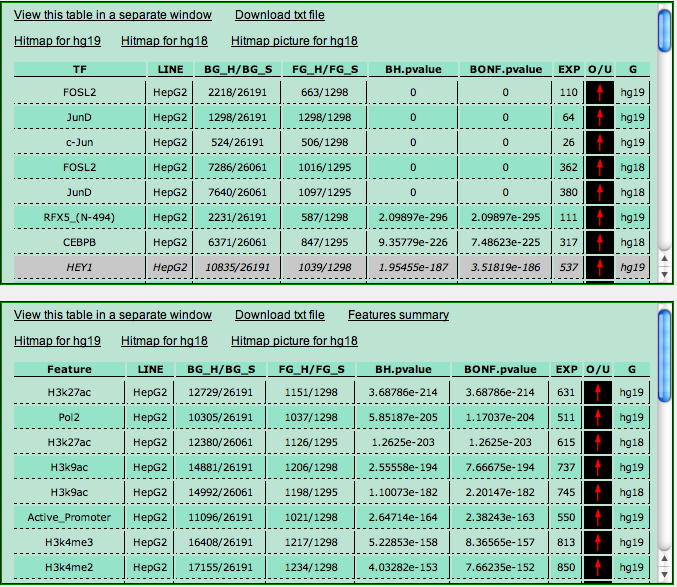
Alternatively, you can focus the analysis on a single cell line by selecting it on the left panel and then filtering the results by clicking again on the "Run!" button.
Output
Regardless of the input parameters you set, when you click the "Run" button, after a few seconds
the result of the computation will appear in
the middle column of the page.
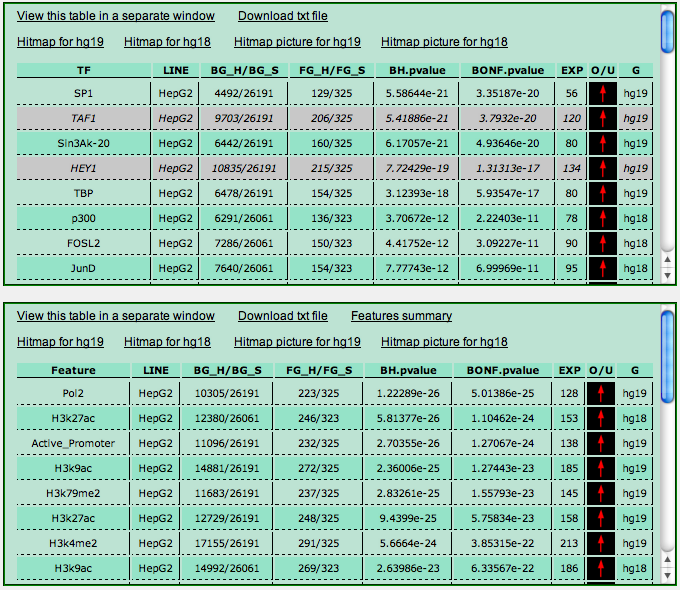
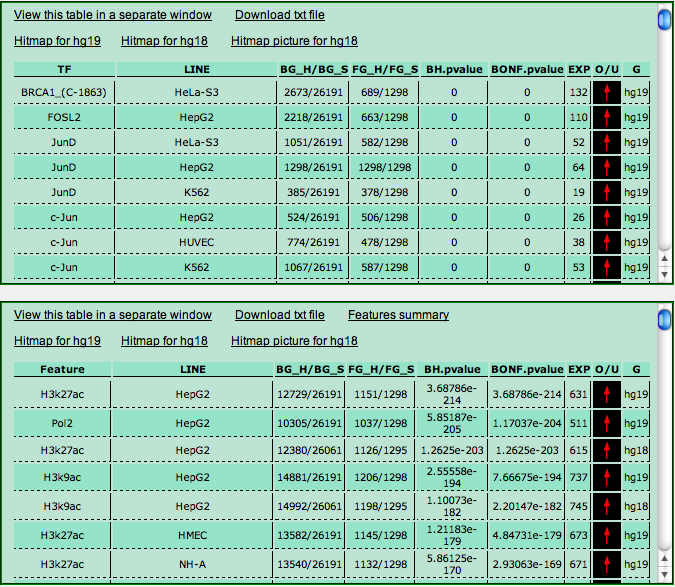
The output is split into two panels. The top panel shows the results of the analysis for transcription factors and other DNA-binding proteins. The bottom panel instead shows the results regarding RNA polymerases, histone modifications, insulator-binding CTCF, and other chromatin related features.
Each ChIP-Seq experiment in the database corresponds to a line in the output tables. Each line has the following fields:
- TF or Feature: the transcription factor or feature investigated in the experiment. In case an identifier appears in brackets after the TF name, it denotes the specific antibody used in the experiment (we have data for the same TF for which different antibodies had been employed.
- Line: the cell line employed to carry out the experiment.
- BG_H/BG_S: number of hits (target transcripts) in the background / size of the background (i.e. the number of RefSeq or ENSEMBL transcript available in the genome annotation used..
- FG_H/FG_S: number of hits (target transcripts) in your sample / size of your sample. Notice that the value of FG_S may be smaller than the actual number of transcripts IDs, since multiple transcript IDs leading to the same genomic region to be analyzed are considered as one.
- BH-pvalue and BONF.pvalue: the enrichment p-value computed with a Fisher's exact test (hypergeometric distribution), further corrected according to the number of experiments available with a the Benjamini-Hockberg or the BOnferroni correction.
- EXP: the expected number of hits for the experiment in your sample, computed according to BG_S, FG_S and FG_H (EXP = [BG_S * (FG_H/FG_S)].
- O/U: a red arrow or a green arrow denoting whether the number of hits is greater (red) or lower (green) than the expected value.
- G: the genome assembly employed in the ChIP-Seq experiment.
The output tables show the ranking of the experiments according to their
enrichment p-values. Table lines with a light red background in the upper panel correspond to experiments where the number of hits in the background (BG_H) is greater than 1/3 of the total number of unique genomic regions in the background (BG_S). The results obtained from these experiments should be taken with a grain of salt, since they could be inaccurate due to the extremely large number of targets (more than 1/3 of the annotated genes) associated to a TF.
At the top
of each table there are further links for: downloading the results in tab-delimited text format ("Download as txt file"), viewing the table in a separate window ("View this table in a separate window", where you will have the possibility to further explore your results as explained below); link(s) to download the "hitmap(s)" generated by your analysis (see The hitmaps section for further details on what "hitmaps" are). See also here for further examples on how Cscan results can be interpreted.
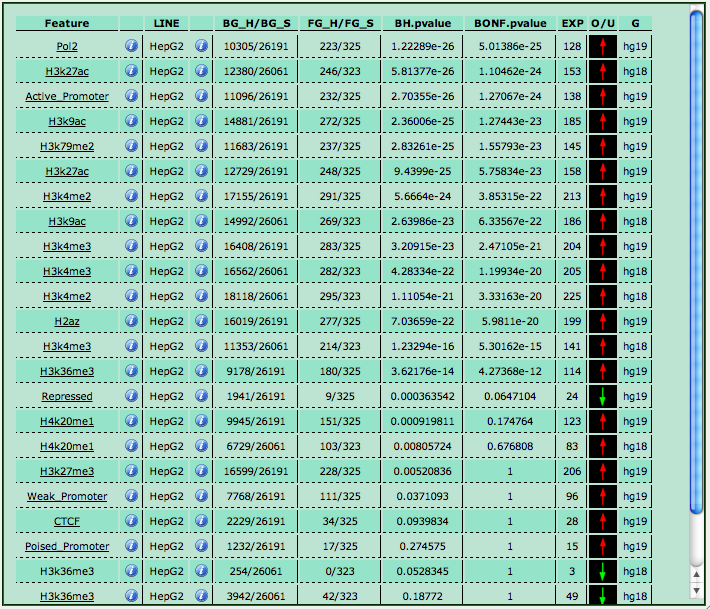
Exploring the output
By clicking on the "View this table in a separate window" link you have access to a more detailed view of your analysis (your browser must allow pop-up windows for this). The  info links provide you with a brief description of the TFs/features and cell lines, when available. Furthermore, you can click on a cell line name to filter your results so that only experiments carried out on that selected cell line are displayed. In this case, a "See ALL lines" link at the bottom of the table allows you to revert the display to all the experiments as before.
By clicking on a TF or feature name, you open a dedicated page
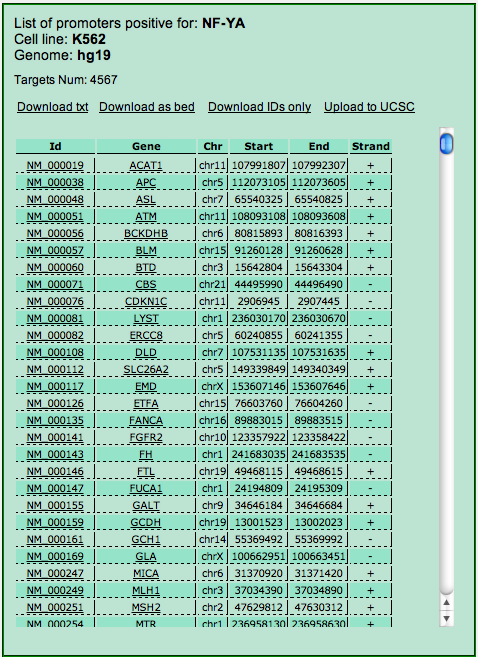
showing up the list of your input genes that are also targets of the selected experiment, that is, have at least one enriched region for to the TF/protein chosen and the corresponding cell line.
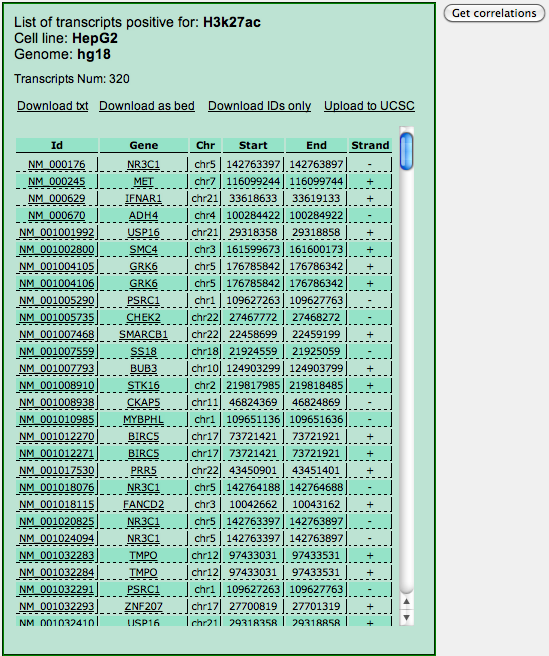
For each target the table reports the ID, the gene name and the genomic coordinates of the region (e.g. the promoter, if this was selected in the input) with the binding site for the selected TF. By clicking on the transcript ID an UCSC Genome Browser page opens up at those coordinates. Clicking on the gene name opens up the annotations page for the gene at NCBI. Four links on the top of the page allow the download of the table displayed as a .txt file, as a .bed file, as a list of IDs and finally the upload of the genomic coordinates to the UCSC Genome Browser in the form of a custom track.
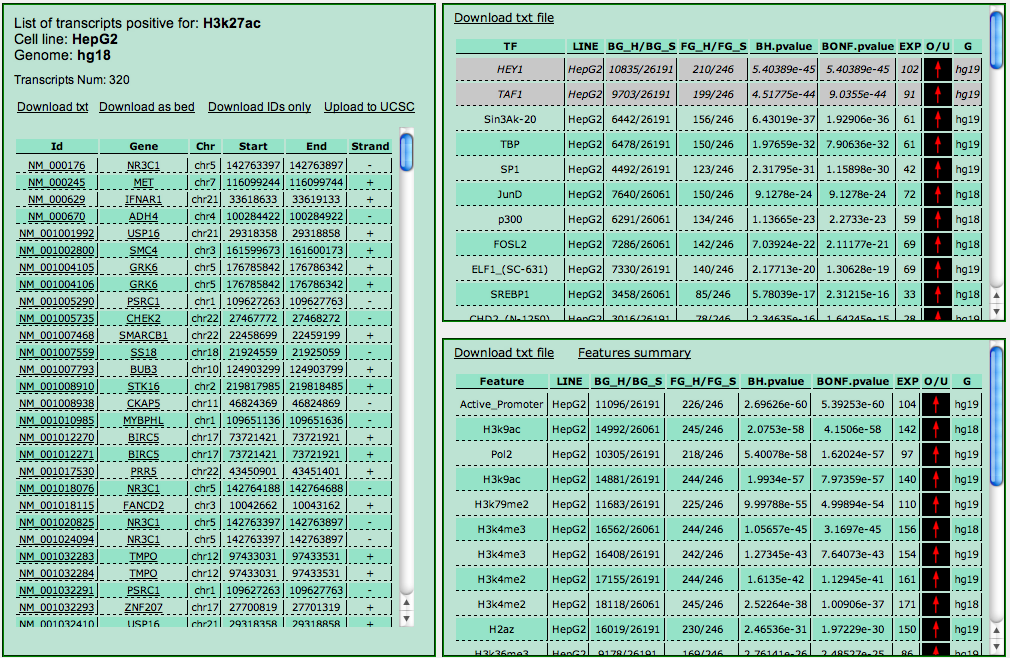
Finally, you can click on the "Get correlations" button (it may take a few seconds to show up since it does not appear until the server is ready to display the results). This will run Cscan on the subset of genes appearing in the list (targeted by the TF/protein selected) with data from all the other experiments performed on the same cell line.
In this way, you can get an idea of which other TFs/protein correlate (or anti-correlate) with the one you selected. Output should be read as the main output of Cscan.
The hitmaps
A nice way of summarizing the result of an analysis is to retrieve the "hitmap" associated with it. The hitmap is a table where you have a line for every input transcript ID and a column for every ChIP-Seq experiment available. The entry corresponding to the x-th line (transcript) and y-th column (ChIP experiment) will be "1" if the ChIP experiment has an enriched region in correspondence with the transcript, "0" otherwise. The hitmap can be the starting point for example for producing a graphical representation of the results, or for clustering the genes according to their respective "hits" or "misses" in the hitmap. Since RefSeq and ENSEMBL transcript annotations differ in the hg18 and hg19 assemblies, two separate hitmaps are produced for hg18 and hg19.
Reading the p-value: when a result is significant?
The p-value associated with each ChIP experiment employed in the analysis is the result of a Fisher exact test (i.e. the same type of test that is usually performed to assess gene ontology term enrichment). The p-value has been already corrected with a Bonferroni or a Benjamini-Hochberg correction. Hence, all the "typical" p-value thresholds employed in statistical testing can be used here to select significant results. Low p-values coupled with a red arrow thus mean "significantly over-represented" in the sample. Vice versa it might happen to find low p-values with a green arrow meaning "significantly under-represented". Be careful however with the experiments whose results are highlighted in red, since the corresponding TF has been predicted to regulate more than one third of the genes/transcript of the genome, and hence finding it over-represented also in your sample is not such a relevant discovery.
Browsing the database
The right-hand column of the initial web page allows you to browse all the ChIP-Seq experiments contained in our data bank, and retrieve the respective target genes.
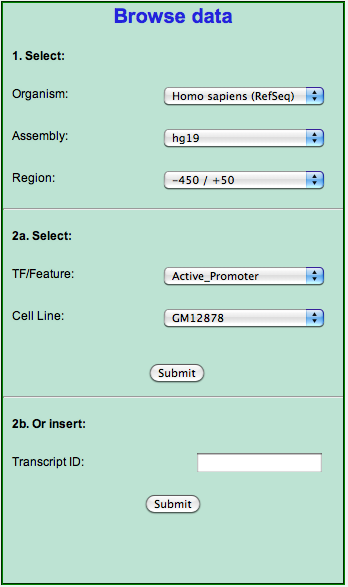
Selecting the organism and the genome assembly and annotation (step 1) automatically sets up the "TF/Feature" drop down menu to display only the available experiments as selecting the TF/feature similarly adjusts the "Cell Line" drop down menu. Once you are satisfied with your choice for the latter (step 2a) you can click the "Submit" button to show up (once again your browser must allow pop-up windows) the table reporting all the targets for the selected experiment. The table is identical to the one described in the Exploring the output section with the exception that it reports all the targets for the selected experiment (and not only those that were in the input), and that it lacks the "Get correlations" button. To perform this, and get the correlations, you can submit the list of IDs thus retrieved for a Cscan analysis.
If instead you are interested in a single gene, and want to retrieve the list of its regulators, you can use the input text box at the bottom of the column, by inserting either the RefSeq or the Ensembl ID of one of its transcripts. Notice that the ID you provide has to be from the same annotation (RefSeq or Ensembl) you selected in the "Organism" choice at the top).
Resetting the interface
At any moment, you can return to the initial web page (with empty input
boxes and no results) by clicking the "Reset" button
in the left-hand column (next to "Run!").
Examples
Some sample gene sets are included in the interface and can be automatically loaded as input.
Cell cycle regulated genes
Phase-specific cell cycle-expressed genes are typical input sets derived from an expression experiment. You'll notice as enriched typical cell-cycle regulators like E2F, NF-Y and so on. You'll also notice in the histone/PolII data how the genes are transcribed (enriched for PolII) and associated with histone marks denoting transcription activation in virtually all cell lines available, i.e. binding and regulation are not cell specific, as you would expect from cell-cycle regulated genes. You can also notice, for example, the differences in binding for the members of the E2F family, which sequence-based promoter analysis cannot discriminate, usually reporting a single "E2F binding site". See the article for further discussion.
Tissue specific genes
Liver and Brain datasets are instead typical "tissue-specific" gene sets. For liver, you'll notice in the bottom output panel that transcription and histone marks associated with active promoters are confined to HepG2 cells (especially if you perform your analysis on the promoter+transcribed region of the gene), while for other cell line you get a signature more consistent with repressed or in general not transcribed genes. For TFs, you'll notice once again that most of the enriched ones come from HepG2 experiments, and if you select only TF experiments on HepG2 cells you get enrichment for liver-specific TFs (HNFs and so on), while binding of more "general" TFs is not significantly enriched.
In the brain dataset, you'll notice that virtally all TFs available are under-represented, with the sole exception of NRSF which is enriched in several different cell lines. However, histones and PolII ChIPs do not indicate transcription activity in the cell lines for which NRSF is enriched, but rather transcription repression. Indeed, NRSF has been shown to repress the expression of neuron-specific genes in non-neuronal cells, hence the correlation between NRSF binding and transcriptional repression you get from Cscan output.
Targets from ChIP-Seq experiments
These datasets have been retrieved from Cscan itself by using the right-hand side panel for browsing the data.
BDP1 target genes are a small example of how targets for a given TF can be correlated to other experiments. Cscan reports as significant BDP1 itself in Hela cells (the source data) but also in K562 - hence no cell-specific binding of BDP1. Other TFs like BRF1, RPC155, TFIIIC and TBP have significant enrichment reported, sharing most of the BDP1 targets. The bottom table shows that transcription activation marks are highly correlated with BDP1, but more significantly is Pol3 to be correlated. Indeed, BDP1 is is a subunit of the TFIIIB transcription initiation complex, which recruits RNA polymerase III to target promoters in order to initiate transcription. Most of the correlated TFs are indeed other PolIII specific factors, but also some other are more "traditional" PolII TFs that nevertheless have been reported in literature to be involved also in the regulation of PolIII genes.
In the JunD experiments you'll notice enrichment (again, not cell-line specific) of several factors building the AP1 complex with JunD, or experimentally known to interact with it.